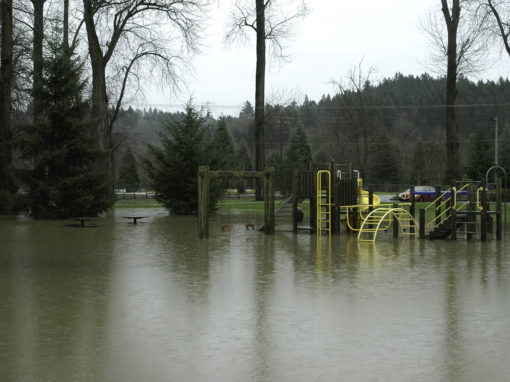
This task is for third grade students to explore weather data and make predictions about the nature of weather in different seasons based on historical data patterns. Scale is also explored as students are asked to explain the difference between weather and climate so some understanding that climate is weather data collected over time, averaged over decades is needed.
Assessment 3D Learning Target
Combine and analyze information to describe climate in different areas that can be used to make predictions.
Standard Addressed
PE: 3-ESS2-2: Obtain and combine information to describe climates in different regions of the world.
By Dimension: Specific dimension pieces that this assessment will center on.
SEP(s):
Obtaining, Evaluating, and Communicating Information
- Obtain and combine information from books and other reliable media to explain phenomena.
Analyzing and Interpreting Data
- Represent data in tables and/or various graphical displays (bar graphs, pictographs and/or pie charts) to reveal patterns that indicate relationships.
DCI(s):
ESS2.D: Weather and Climate
- Climate describes a range of an area’s typical weather conditions and the extent to which those conditions vary over years.
CCC(s):
Patterns
- Patterns of change can be used to make predictions.
Files
- Teacher Guide
- Task Facilitation Slides
- Student Task Document
- Sense-Making Tool (coming soon)
Other Assessment Resources >
Creators
- Jeff Ryan, Olympic Educational Service District
- Sarah Neyman, Bellingham Public Schools
- Alisa Winkler, Renton School District


